
Organic Surface Geochemistry Laboratory
Contact
GFZ Websites
Infrastructure belongs to
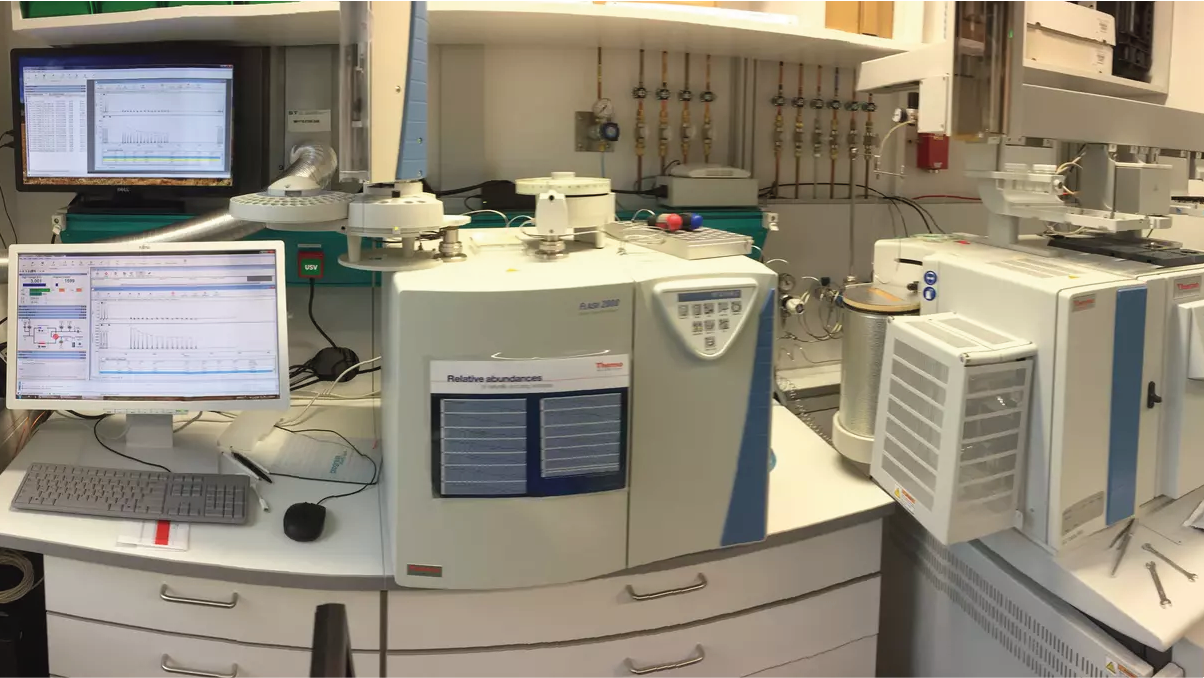
In the Organic Surface Geochemistry Lab (OSGLab) of the Geomorphology section, the smallest of molecules and isotopes open a door to the past. In the OSGLab we conduct research on regional differences of the causes and effects of past climate change and variations in biochemical cycles. In some projects, we can determine the "traces" of climate change down to a decade, in other projects biogeochemical processes are traced over millions of years.
In the laboratory, changes in the carbon cycle can be reconstructed from plants and microorganisms using so-called biomarkers. Biomarkers are resistant organic molecules that can be assigned to an organism. Their characteristic structures show which plant or algae produced them. Parts of plants enter lakes and seas via soils and rivers and are deposited there in sediments. Over thousands of years, the plant parts decompose, but their biomarkers remain behind, turning them into molecular fossils, so to speak. We sample the sediments and examine the biomarkers they contain in the laboratory.
Detailed information on the laboratories' instruments can be found here.
Any inquiry about analytical possibilities and discussions of project ideas should be directed to O. Rach or D. Sachse.
Categories
Disciplinary Keywords
- Accelerated Solvent Extraction
- Automated Solid Phase Extraction
- Cavity Ring Down Spectroscopy
- Desulfurization
- Drying
- Elemental Analysis
- Elemental Analyzer Isotope Ratio Mass Spectrometry
- Fast Solvent Extraction
- Gas Chromatography Flame Ionization Detector Mass Spectrometry
- Gas Chromatography Isotope Ratio Mass Spectrometry
- Geochemistry
- Geology
- Geomorphology
- High Performance Liquid Chromatography Mass Spectrometry
- Paleoclimate
- Separation Saturated/Unsaturated Hydrocarbons
- Solid-Phase Extraction
- Total Organic Carbon Analysis
- δD
- δ¹³C
- δ¹⁵N
- δ¹⁷O
- δ¹⁸O
Selected infrastructures
Instrumentation
Laboratory instrumentation
Instruments
-
Accelerated Solvent Extractor
-
Automated Solid Phase Extractor
-
Cavity Ring Down Spectrometer
Nearly every small gas-phase molecule (e.g., CO2, H2O, H2S, NH3) has a unique near-infrared absorption spectrum. At sub-atmospheric pressure, this consists of a series of narrow, well-resolved, sharp lines, each at a characteristic wavelength. Because these lines are well-spaced and their wavelength is well-known, the concentration of any species can be determined by measuring the strength of this absorption, i.e. the height of a specific absorption peak. But, in conventional infrared spectrometers, trace gases provide far too little absorption to measure, typically limiting sensitivity to the parts per million at best. CRDS - Cavity Ring-Down Spectroscopy - avoids this sensitivity limitation by using an effective pathlength of many kilometers. It enables gases to be monitored in seconds or less at the parts per billion level, and some gases at the parts per trillion level.
In CRDS, the beam from a single-frequency laser diode enters a cavity defined by two or more high reflectivity mirrors. Picarro analyzers use a three-mirror cavity, as in the figure below, to support a continuous traveling light wave. This provides superior signal to noise compared to a two-mirror cavity that supports a standing wave. When the laser is on, the cavity quickly fills with circulating laser light. A fast photodetector senses the small amount of light leaking through one of the mirrors to produce a signal that is directly proportional to the intensity in the cavity.
When the photodetector signal reaches a threshold level (in a few tens of microseconds), the continuous wave (CW) laser is abruptly turned off. The light already within the cavity continues to bounce between the mirrors (about 100,000 times), but because the mirrors have slightly less than 100% reflectivity (99.999%), the light intensity inside the cavity steadily leaks out and decays to zero in an exponential fashion. This decay, or "ring down", is measured in real-time by the photodetector, and the amount of time it takes for the ring down to happen is determined solely by the reflectivity of the mirrors (for an empty cavity). Consider that for a Picarro cavity of only 25 cm in length, the effective pathlength within the cavity can be over 20 kilometers.
Now, if a gas species that absorbs the laser light is introduced into the cavity, a second loss mechanism within the cavity (absorption) is now introduced. This accelerates the ring down time compared to a cavity without any additional absorption due to a targeted gas species. Picarro instruments automatically and continuously calculate and compare the ring down time of the cavity with and without absorption due to the target gas species. This produces precise, quantitative measurements that account for any intra-cavity loss that may be changing over time, and it allows the discrimination of loss due to absorption from losses due to the cavity mirrors. Furthermore, the final concentration data is particularly robust because it is derived from the difference between these ring down times and is therefore independent of laser intensity fluctuations or absolute laser power.
This scheme of comparing the ring down time of the cavity without any absorbing gas, with the ring down time when a target gas is absorbing light is accomplished not by removing the gas from the cavity, but rather by using a laser whose wavelength can be tuned. By tuning the laser to different wavelengths where the gas absorbs light, and then to wavelengths where the gas does not absorb light, the "cavity only" ring down time can be compared to the ring down time when a target gas is contributing to the optical loss within the cavity. In fact, the laser is tuned to several locations across the target gas's spectral absorption line (and ring down measurements are conducted at all these points) and a mathematical fit to the shape of that absorption line is what is actually used to calculate the gas concentration. (Source: Global Change Master Directory (GCMD). 2023. GCMD Keywords, Version 16.3. Greenbelt, MD: Earth Science Data and Information System, Earth Science Projects pision, Goddard Space Flight Center (GSFC) National Aeronautics and Space Administration (NASA). URL (GCMD Keyword Forum Page): https://forum.earthdata.nasa.gov/app.php/tag/GCMD+Keywords)
-
Elemental Analyzer
Instrument used for measuring carbon, hydrogen, nitrogen, sulfur or oxygen content in organic and other types of materials. (Source: Global Change Master Directory (GCMD). 2023. GCMD Keywords, Version 16.3. Greenbelt, MD: Earth Science Data and Information System, Earth Science Projects pision, Goddard Space Flight Center (GSFC) National Aeronautics and Space Administration (NASA). URL (GCMD Keyword Forum Page): https://forum.earthdata.nasa.gov/app.php/tag/GCMD+Keywords)
-
Elemental Analyzer Isotope Ratio Mass Spectrometer
Measurement and study of the relative abundances of the different isotopes of an element in a material using a mass spectrometer which is coupled with an elemental analyzer. (Source: IUPAC; https://doi.org/10.1351/PAC-REC-06-04-06)
-
Fast Automated Solvent Extraction (EDGE)
-
Freeze Dryer
-
Gas Chromatography Flame Ionization Detector Mass Spectrometer
-
Gas Chromatography Isotope Ratio Mass Spectrometer
-
High Performance Liquid Chromatography Mass Spectrometer
-
Vacuum Gas Manifold
Links
GFZ Websites
Data Publication
Key Publication
- Rach, O., Hadeen, X., Sachse, D. (2020): An automated solid phase extraction procedure for lipid biomarker purification and stable isotope analysis. - Organic Geochemistry, 142, 103995.
- Rach, O., Kahmen, A., Brauer, A., Sachse, D. (2017): A dual-biomarker approach for quantification of changes in relative humidity from sedimentary lipid D/H ratios. - Climate of the Past, 13, 7, 741-757.